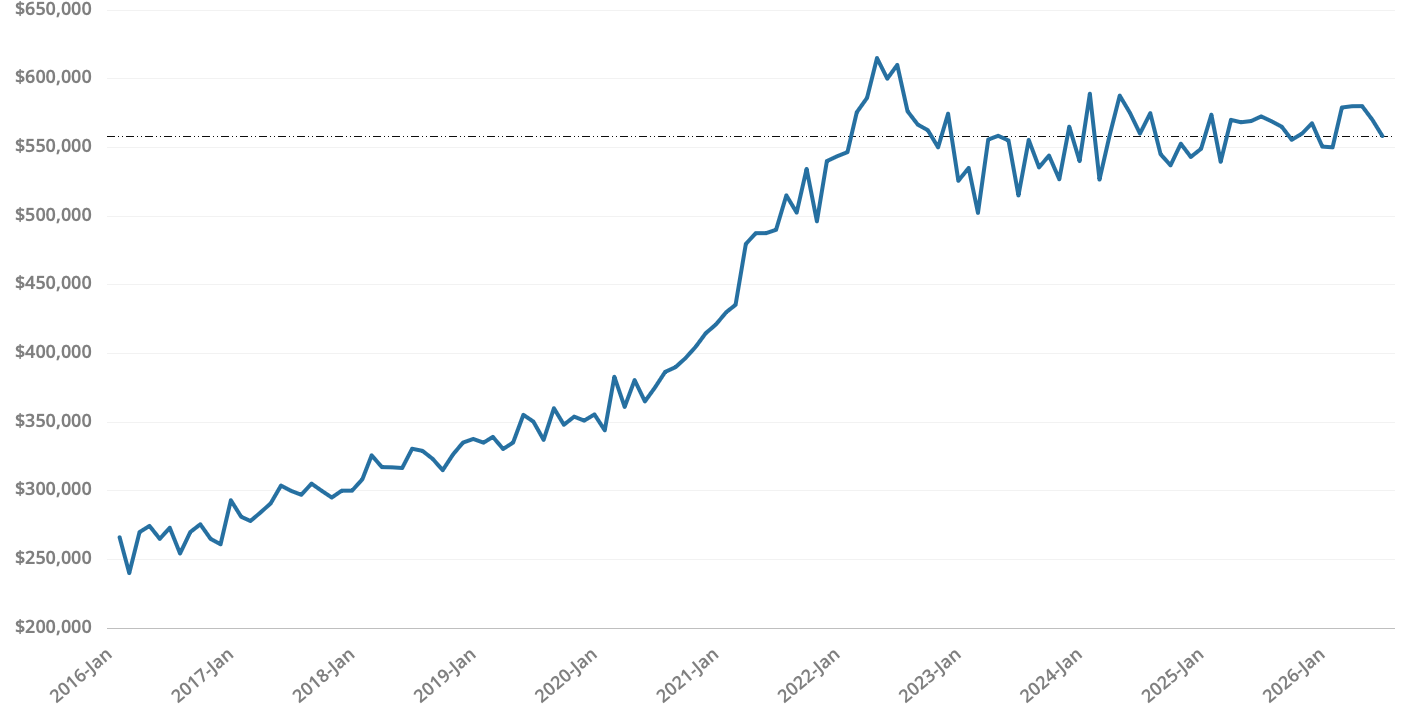
Washington County, Utah (primarily the St. George metro area, including Ivins, Hurricane, Washington City, and surrounding communities) real estate market over the last 12 months (roughly July 2025–June 2026) has transitioned into a more balanced, buyer-friendly environment. Inventory has risen meaningfully from the extremely tight conditions of prior years, giving buyers more choices and negotiation leverage, while overall demand remains steady due to the area’s strong population growth, lifestyle appeal (retirement destination, proximity to Zion National Park and outdoor recreation), and in-migration. Prices have largely stabilized after the rapid appreciation of the pandemic/early post-pandemic boom, showing modest fluctuations rather than sharp declines or continued double-digit gains.
The market is no longer the frantic seller’s market of 2021–early 2024 (low inventory, quick sales, multiple offers, and frequent over-list sales). It has normalized into a balanced state (roughly 4–6 months of supply is traditionally neutral), with some buyer advantages but still solid fundamentals supporting values. Local reports describe it as offering “more room to shop and negotiate” while “steady demand” persists.
Sales Volume and Activity
Closed sales have been resilient overall, with year-to-date (YTD) figures through mid-2026 showing slight gains or near-flat performance compared to 2025 in several local aggregates.
- One detailed local update (through June 2026) reported 2,698 closed sales YTD, up 1.8% from the prior year, with a median sale price up 2.7% to $515,000.
- Specific monthly snapshots vary: May 2026 saw around 374 homes sold county-wide (down ~10.7% YoY in one report, with YTD sales up modestly). June 2026 had 462 sold in one county-wide update and 206 in a St. George-focused report (down ~5.5% YoY for the city).
- St. George-specific YTD sales through June 2026 were down modestly (~4%) in one analysis, but broader county figures often show stability or slight growth.
New listings have remained relatively steady or increased in some periods, while pending/sold activity has not always kept perfect pace, contributing to inventory buildup. Absorption rates (months of supply) have risen to the balanced range of approximately 5–5.7 months in recent reports (e.g., 5.66 months noted in a May update; ~5.3 months for St. George in June).
Overall, transaction volume reflects sustained (if more selective) demand rather than a collapse. Higher mortgage rates have tempered affordability and buyer urgency compared to the low-rate boom years, but the area’s desirability continues to draw retirees, remote workers, and others.
Pricing Trends
Median sale prices have hovered primarily in the $500,000–$550,000 range across sources, with modest YoY changes—sometimes slight gains, sometimes flat or minor dips depending on the exact period, segment, and data source (differences arise from methodologies, home types included, and whether focusing on St. George city vs. broader county).
Key recent data points include:
- YTD median around $515,000 (up ~2.7% in one local June 2026 update); another St. George-focused report showed YTD median ~$508,600 (up 1.61% YoY).
- June 2026 St. George median sale price ~$507,000 (down 8.4% from the unusually high June 2025 figure in that dataset, but part of a broader stabilizing picture).
- Redfin (3 months ending May 2026): County median sale ~$547,000 (down 0.43% YoY); price per square foot ~$264 (down 3.8% YoY).
- Realtor.com (around June 2026): County median sold ~$500,000 (down 0.74% YoY); median listing ~$630,000 (down 3.61% YoY).
- Zillow home values (around May/June 2026): County average ~$530,000 (down ~1% over the past year).
Listing prices have shown more noticeable softening in some metrics (down several percent YoY), giving buyers leverage. Homes are typically selling at 97–99% of list price (e.g., 98.2–98.5% in recent local reports), indicating negotiation room, occasional price reductions (especially on overpriced or slower-moving properties), and some seller concessions.
Longer context: Prices rose rapidly in prior years but flattened or grew only modestly through 2025 into 2026. Some mid-2025 reports noted continued resilience or selective gains (e.g., +18% YoY in one October 2025 snapshot, though that appears outlier or segment-specific). Luxury or higher-end segments ($700k+) have sometimes seen slower movement or more softening than mid-range homes.
Price per square foot trends are generally flat to slightly down in recent data (~$260–$290 range). Values have held up better than feared in a higher-rate environment, supported by limited supply in desirable pockets and strong underlying demand.
Inventory and Market Pace (Days on Market)
This is where the biggest shift occurred. Inventory has increased substantially year-over-year and continued building through 2025–2026.
- Active listings: Recent figures range from ~1,073 (St. George-focused, June 2026, up sharply from early 2026 levels) to 2,598+ or even ~3,800 county-wide in broader reports (up 10–60% YoY depending on source and exact definition of “active”).
- Months of supply/absorption: Moved into the balanced ~5–6 month range (up from tighter levels previously).
- Median days on market (DOM): Increased to the 50–80 day range in most recent data (e.g., Redfin ~51 days; local June reports ~35 days city or 73 days county; Realtor.com ~77 days). This is longer than the ultra-fast pandemic era but still reasonable. Some reports note homes selling faster when priced competitively.
Buyers now have meaningful selection and time to evaluate properties, inspect, and negotiate. Well-priced, move-in-ready homes in popular communities (e.g., certain master-planned areas) still move relatively well; overpriced or dated listings sit longer and may require adjustments.
Key Drivers and Context
Positive demand factors: Washington County remains one of Utah’s faster-growing areas (third-highest housing demand in the state per some local Board of Realtors commentary). Population estimates put the county around 214,000 in 2025, with long-term projections still calling for substantial growth (tens of thousands more residents over the coming decade+), though some forecasts were revised modestly downward in late 2025. Retirees, lifestyle migrants, and some economic drivers (tourism, Utah Tech University, healthcare) support housing needs. New construction has helped add supply, particularly in certain corridors.
Headwinds: Higher mortgage rates (around 6.6%+ in mid-2026 snapshots) have raised monthly payments and affected qualification/affordability, especially relative to local wages. Inventory buildup reflects both more sellers listing and a more measured buyer pace. Some softening in luxury or higher price tiers.
The market cooled from the extreme seller conditions of prior years but has avoided a broad crash—values stabilized rather than plummeted. This aligns with many Sun Belt and mountain-west markets post-rate hikes.
Buyer vs. Seller Conditions and Outlook
Buyers currently have advantages: more inventory for comparison shopping, time to negotiate (repairs, concessions, price), and less competition in many segments. Pre-approval remains important, and focusing on well-maintained properties or new construction (where builder incentives like rate buydowns sometimes appear) can be strategic. Affordability challenges persist for entry-level or workforce buyers.
Sellers can still succeed but must price realistically based on current comps, invest in presentation/staging/marketing, and be flexible. Overpriced listings are more likely to linger. Move-in-ready homes in desirable locations continue to attract interest.
Near-term outlook (into late 2026 and beyond): Expect continued balanced conditions with steady (not explosive) activity. Modest price support or slight appreciation is possible if rates ease or stabilize, aided by ongoing population/household growth needs. Risks include prolonged high rates, economic softness, or localized oversupply. Long-term fundamentals (desirability + growth) remain positive for the region.
Note on data variations: Real estate statistics differ slightly across sources (Redfin, Zillow, Realtor.com, local MLS via Washington County Board of Realtors/UtahRealEstate.com, and individual team reports) due to coverage, inclusions (e.g., all homes vs. single-family), and timing. Local MLS data is often most relevant for practitioners. Medians can also shift with the mix of sales (more luxury or entry-level closings in a given month).
Robert Bolar is a top realtor in Washington County and the highest rated Real Estate agent in Ivins, Utah.